Bitcoin Price Analysis: BTC Faces First Major Test After 13% Weekly Rally
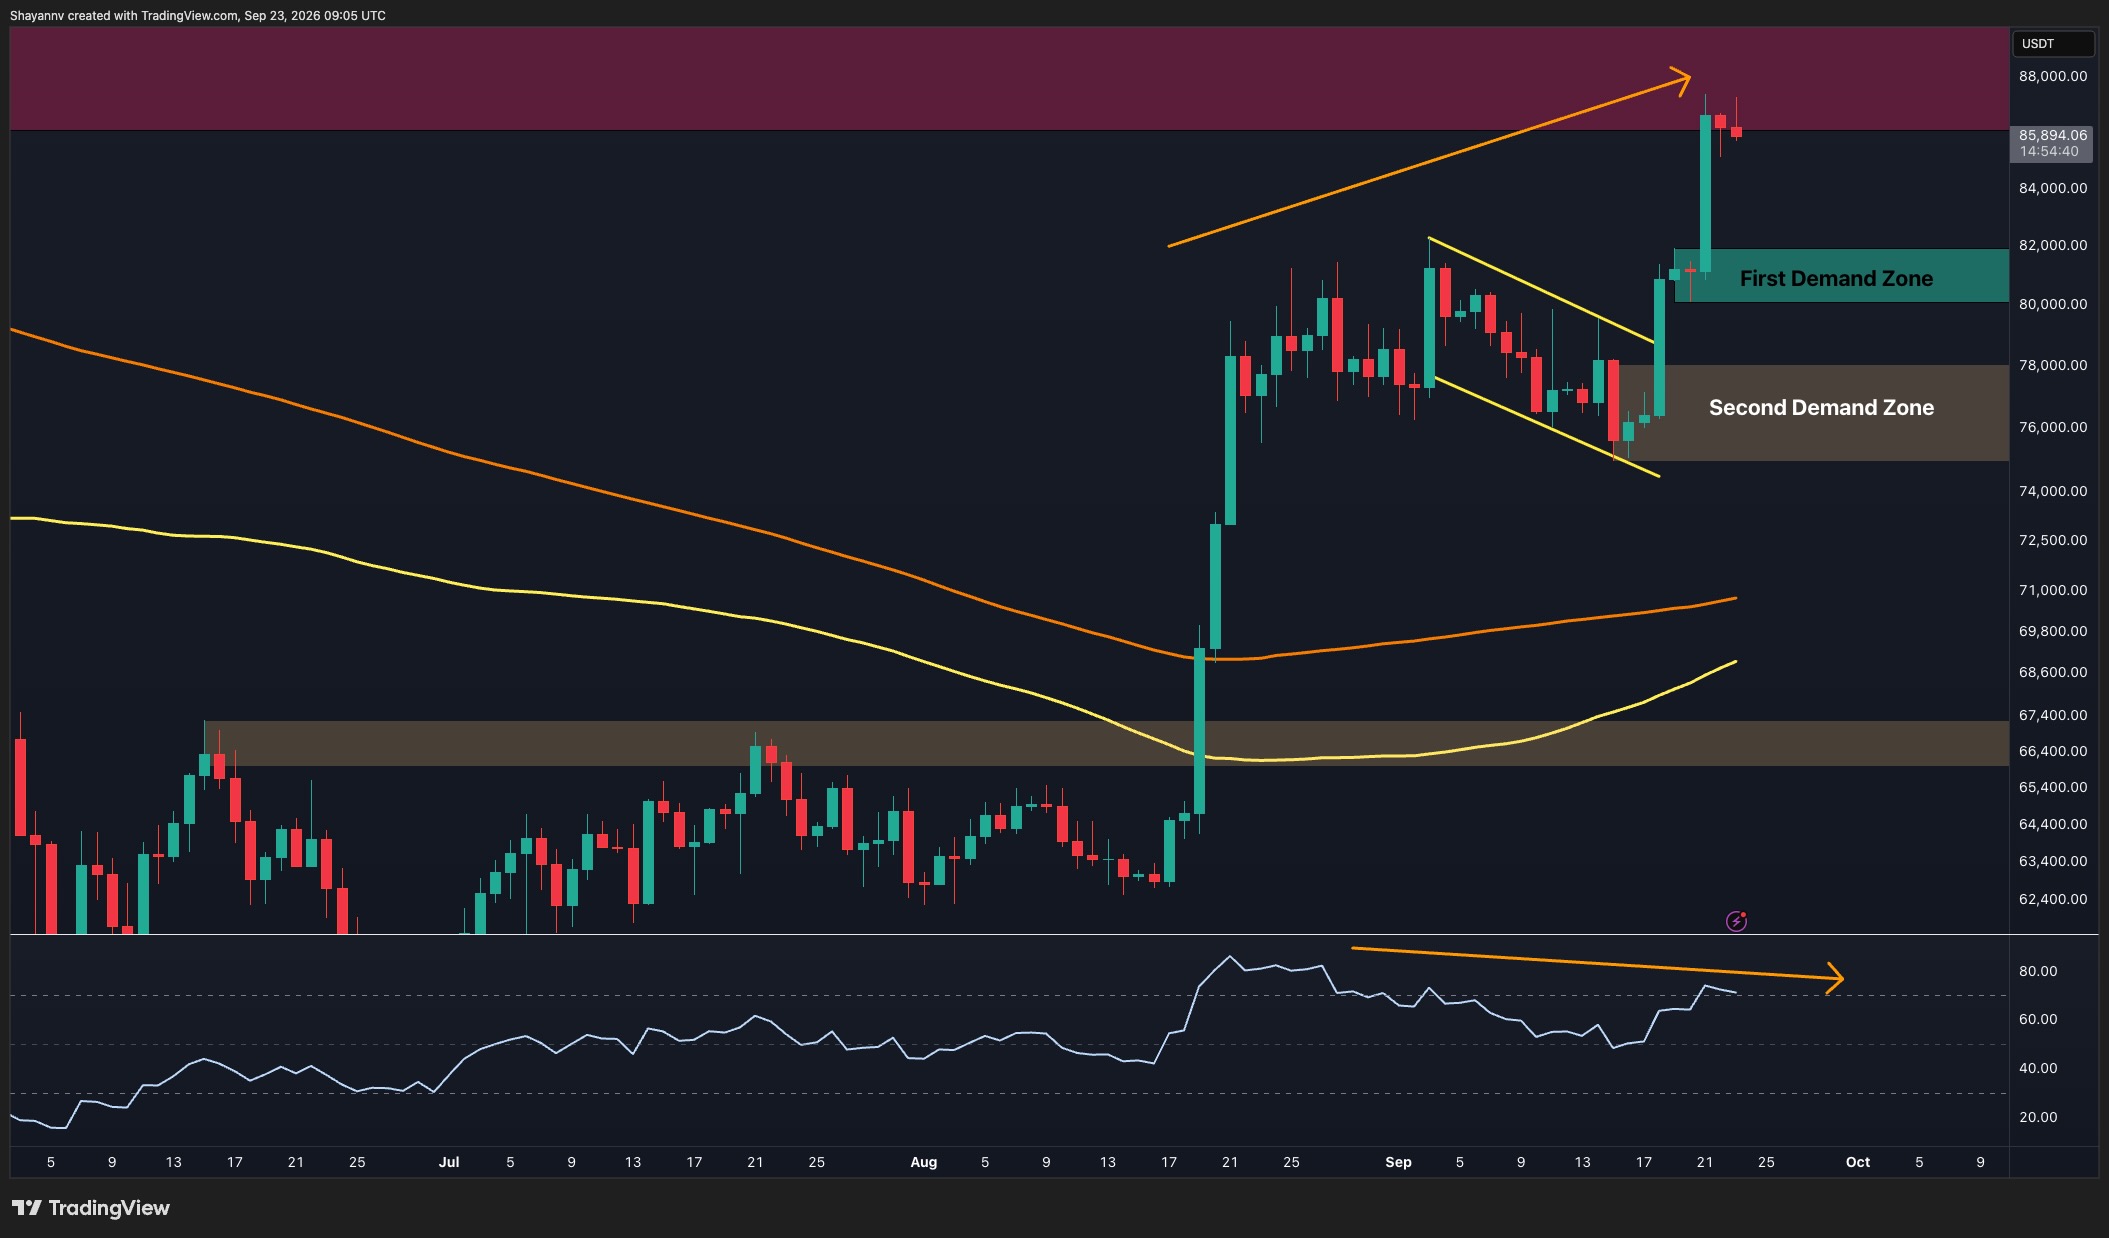
Bitcoin’s latest leg up has carried the price directly into a major overhead supply region, putting the rally at an important test.
Momentum remains constructive, but the reaction around the $86K-$89K area could determine whether the move develops into another bullish leg or pauses for a deeper retest.
Bitcoin Price Analysis: The Daily Chart On the daily timeframe, Bitcoin has extended its recovery significantly after breaking out of the previous corrective structure.
The asset is now trading around $86K and has entered the major $86K-$89K resistance zone highlighted on the chart. The broader structure remains bullish.
This page shows the RSS-provided summary/preview. Full publisher content remains available at the original source.
Read Full Article at Source