Bitcoin Price Analysis: What’s Next for BTC After Massive 12% Daily Surge?
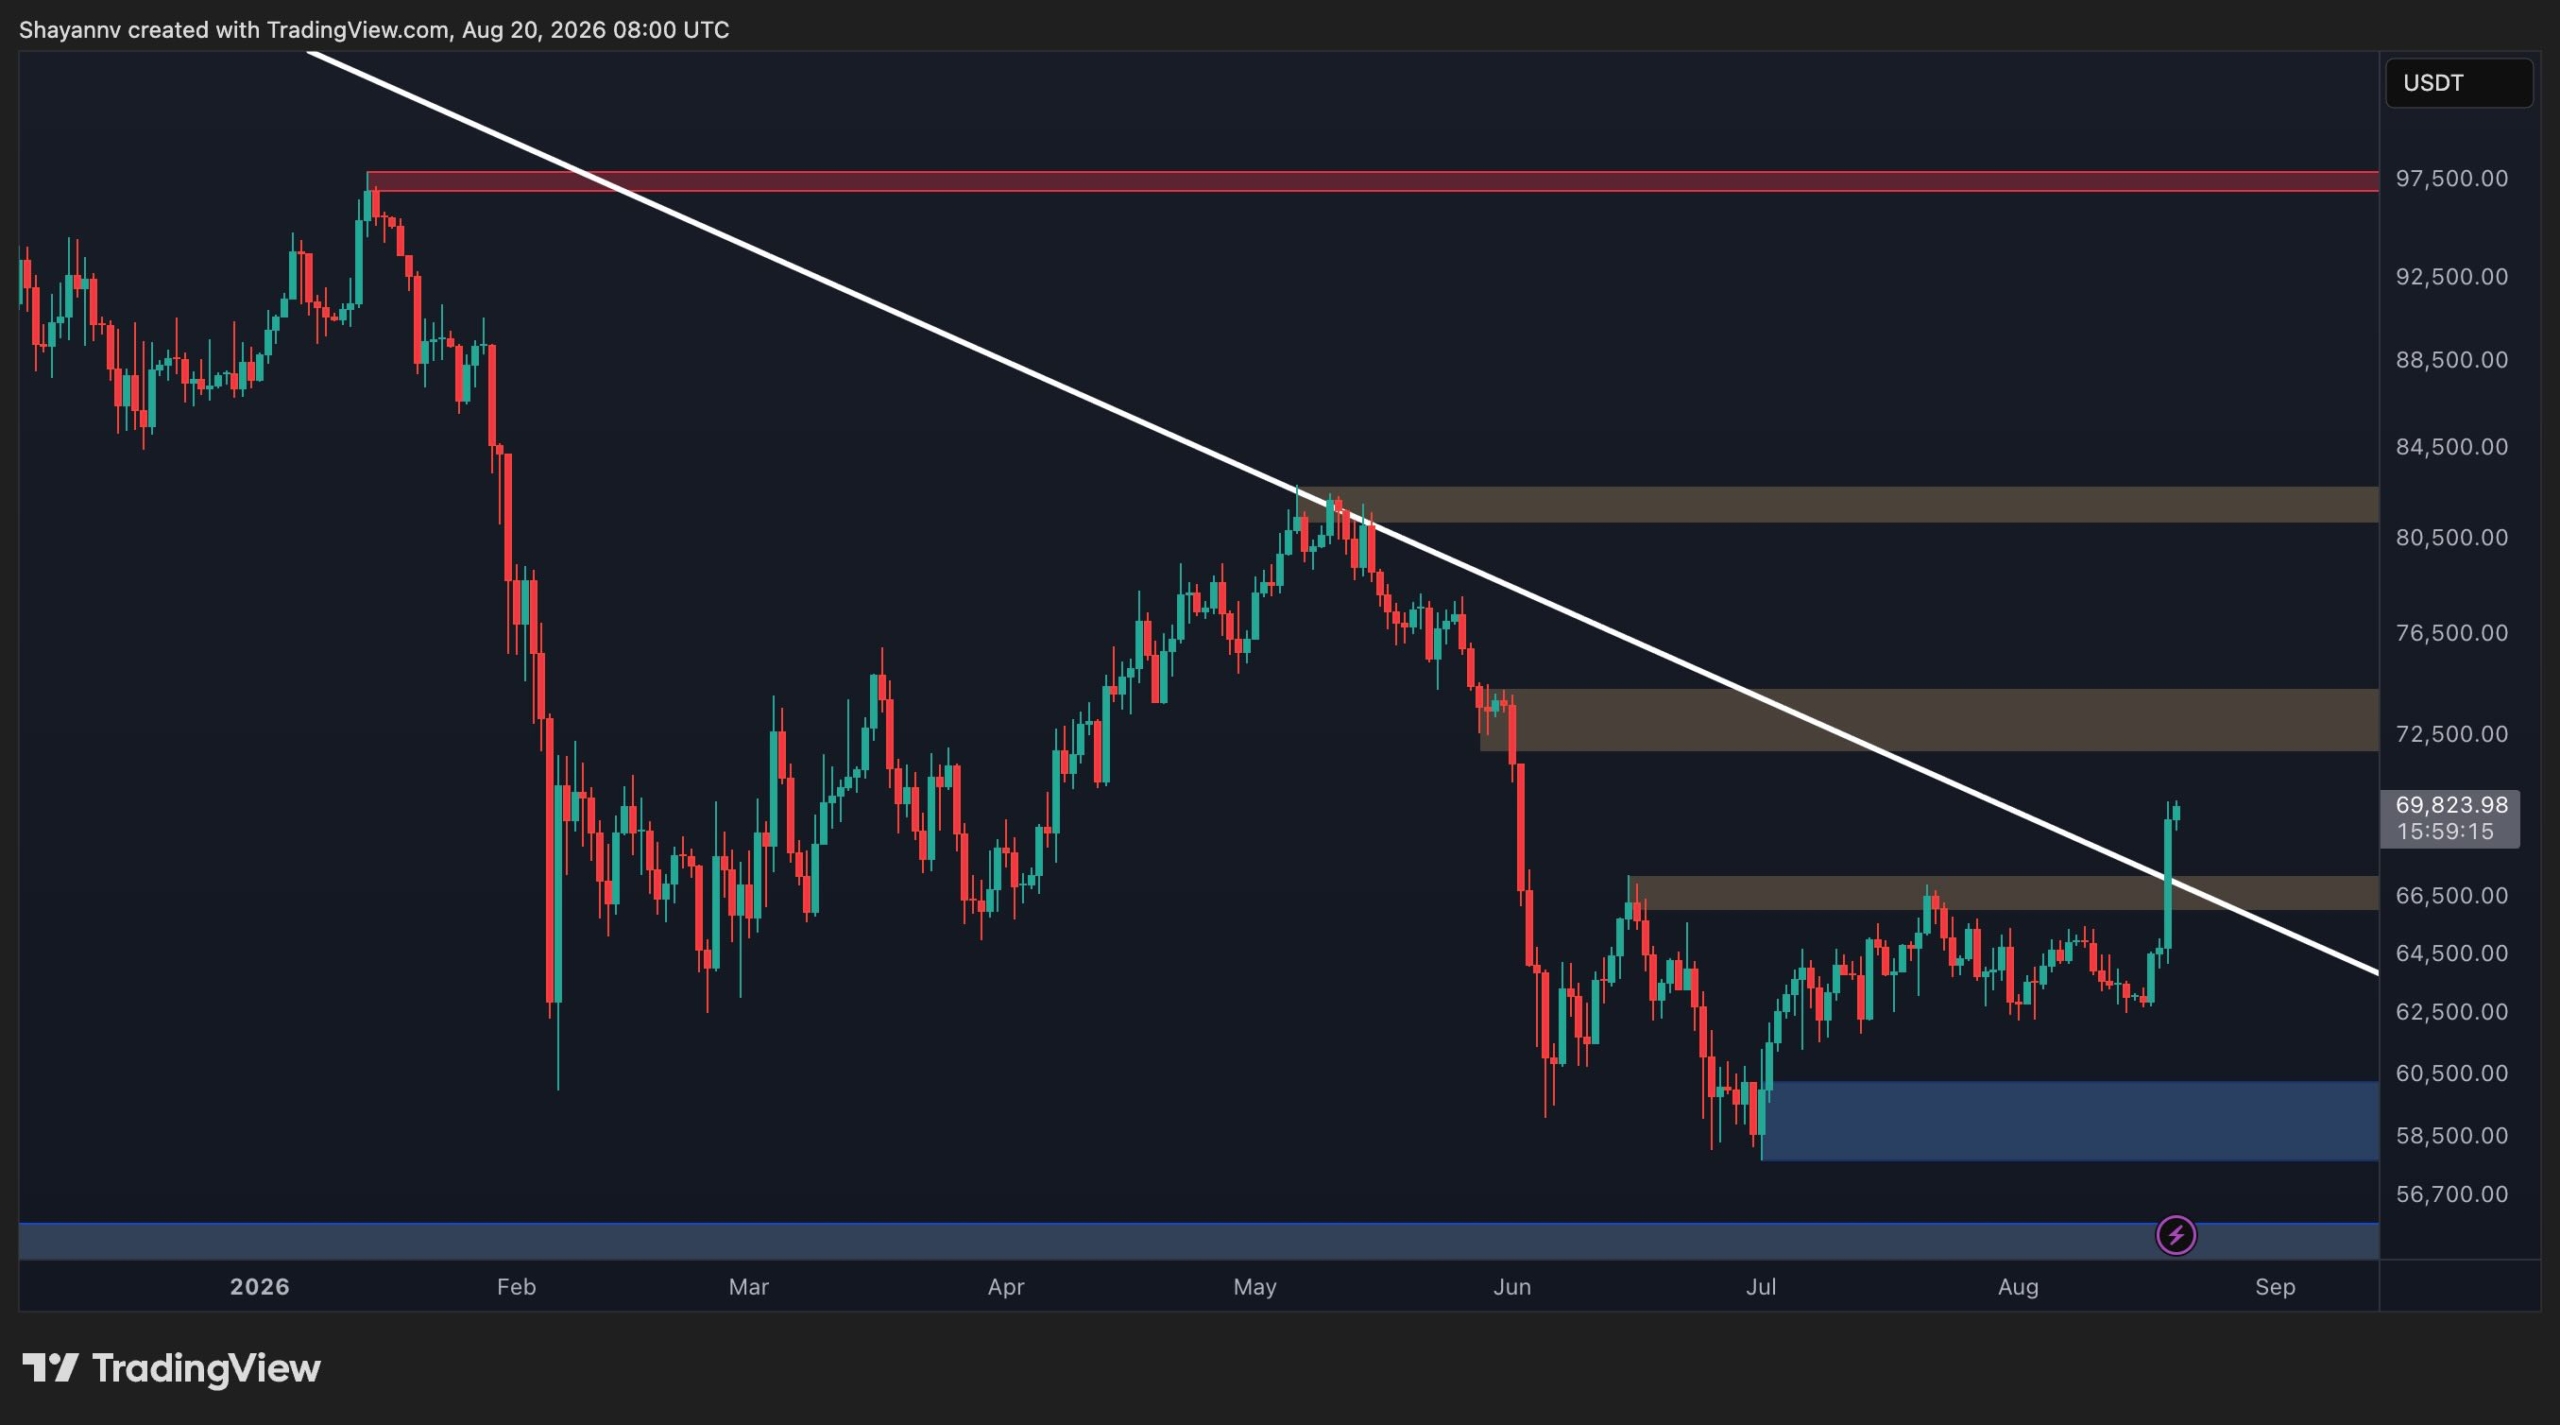
Bitcoin has staged a sharp recovery from the lower end of its recent range, pushing back toward $70K after spending several weeks consolidating below a descending trendline.
The latest move has improved the short-term structure considerably, although BTC is now approaching an important resistance cluster that could determine whether this is the start of a broader recovery or simply a range breakout that needs confirmation.
Bitcoin Price Analysis: The Daily Chart The daily chart shows Bitcoin recovering from the $60K support area after a prolonged decline from the all-time highs.
The price subsequently formed a broad consolidation structure, with the market repeatedly finding buyers around the $60K-$62K region while rallies were capped by a descending trendline. The most important development is the latest breakout.
This page shows the RSS-provided summary/preview. Full publisher content remains available at the original source.
Read Full Article at Source