Bitcoin Price Analysis: Will BTC Crash Below $70K Next as Selling Pressure Intensifies?
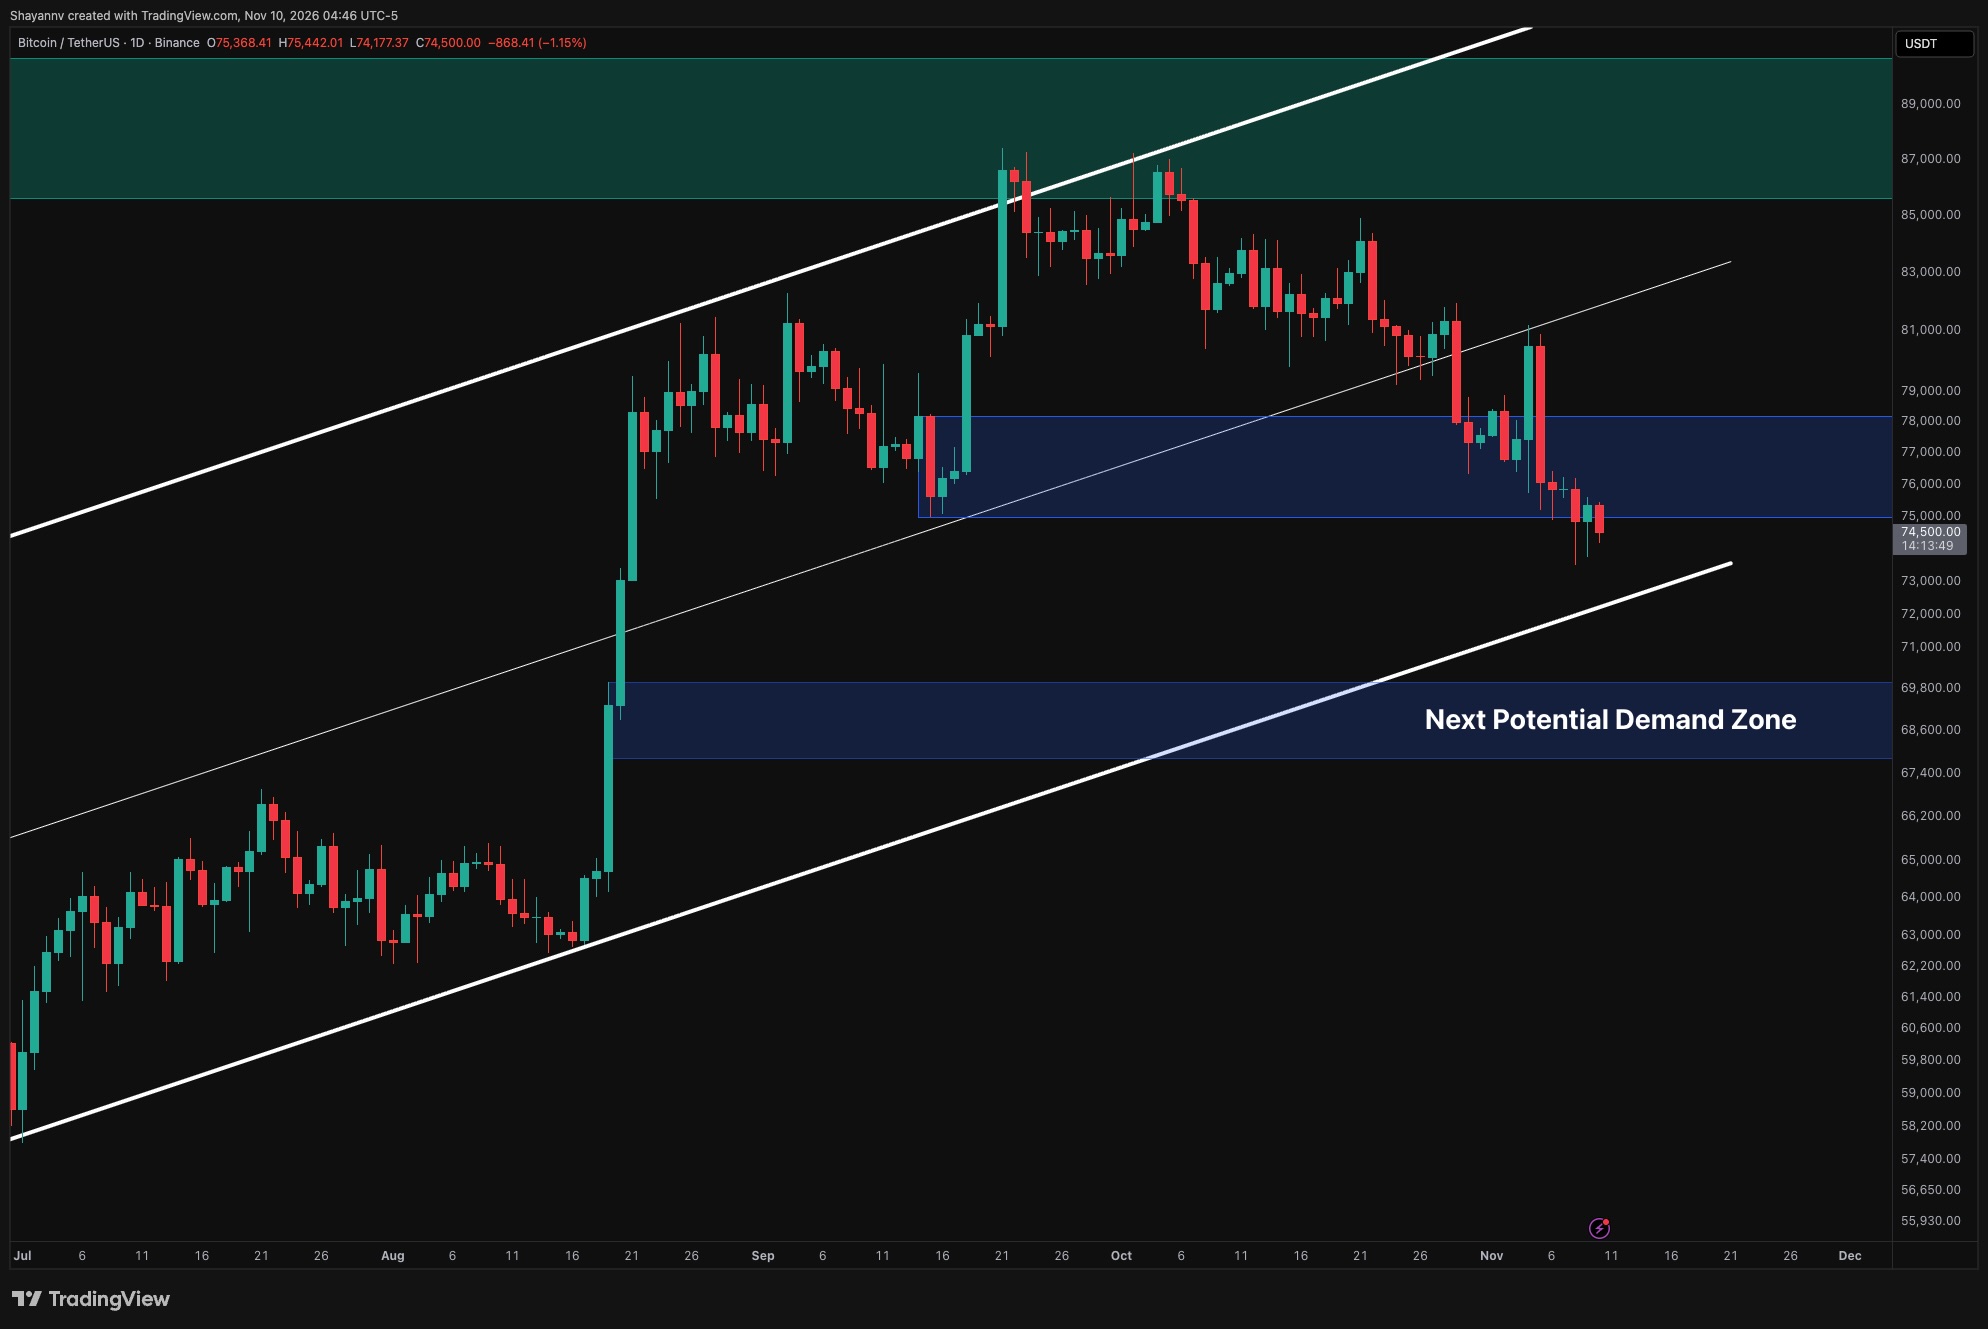
Bitcoin has slipped beneath the $74K support area, leaving buyers struggling to regain control near $74.5K. The latest breakdown increases the risk of a deeper correction, while the liquidation heatmap highlights nearby concentrations on both sides of the market.
Bitcoin Price Analysis: The Daily Chart The daily chart shows Bitcoin trading below the lower boundary of the $75K–$78K demand zone following repeated tests.
The earlier recovery toward $81K was rejected near the ascending channel’s midpoint, and subsequent rebounds have failed to reverse the sequence of lower highs and lower lows.
Although recent candles show buying interest beneath $74K, the response has been insufficient to reclaim the broken demand zone sustainably.
This page shows the RSS-provided summary/preview. Full publisher content remains available at the original source.
Read Full Article at Source