Bitcoin Price Analysis: Will the Next Liquidity Sweep Push BTC Below $60K?
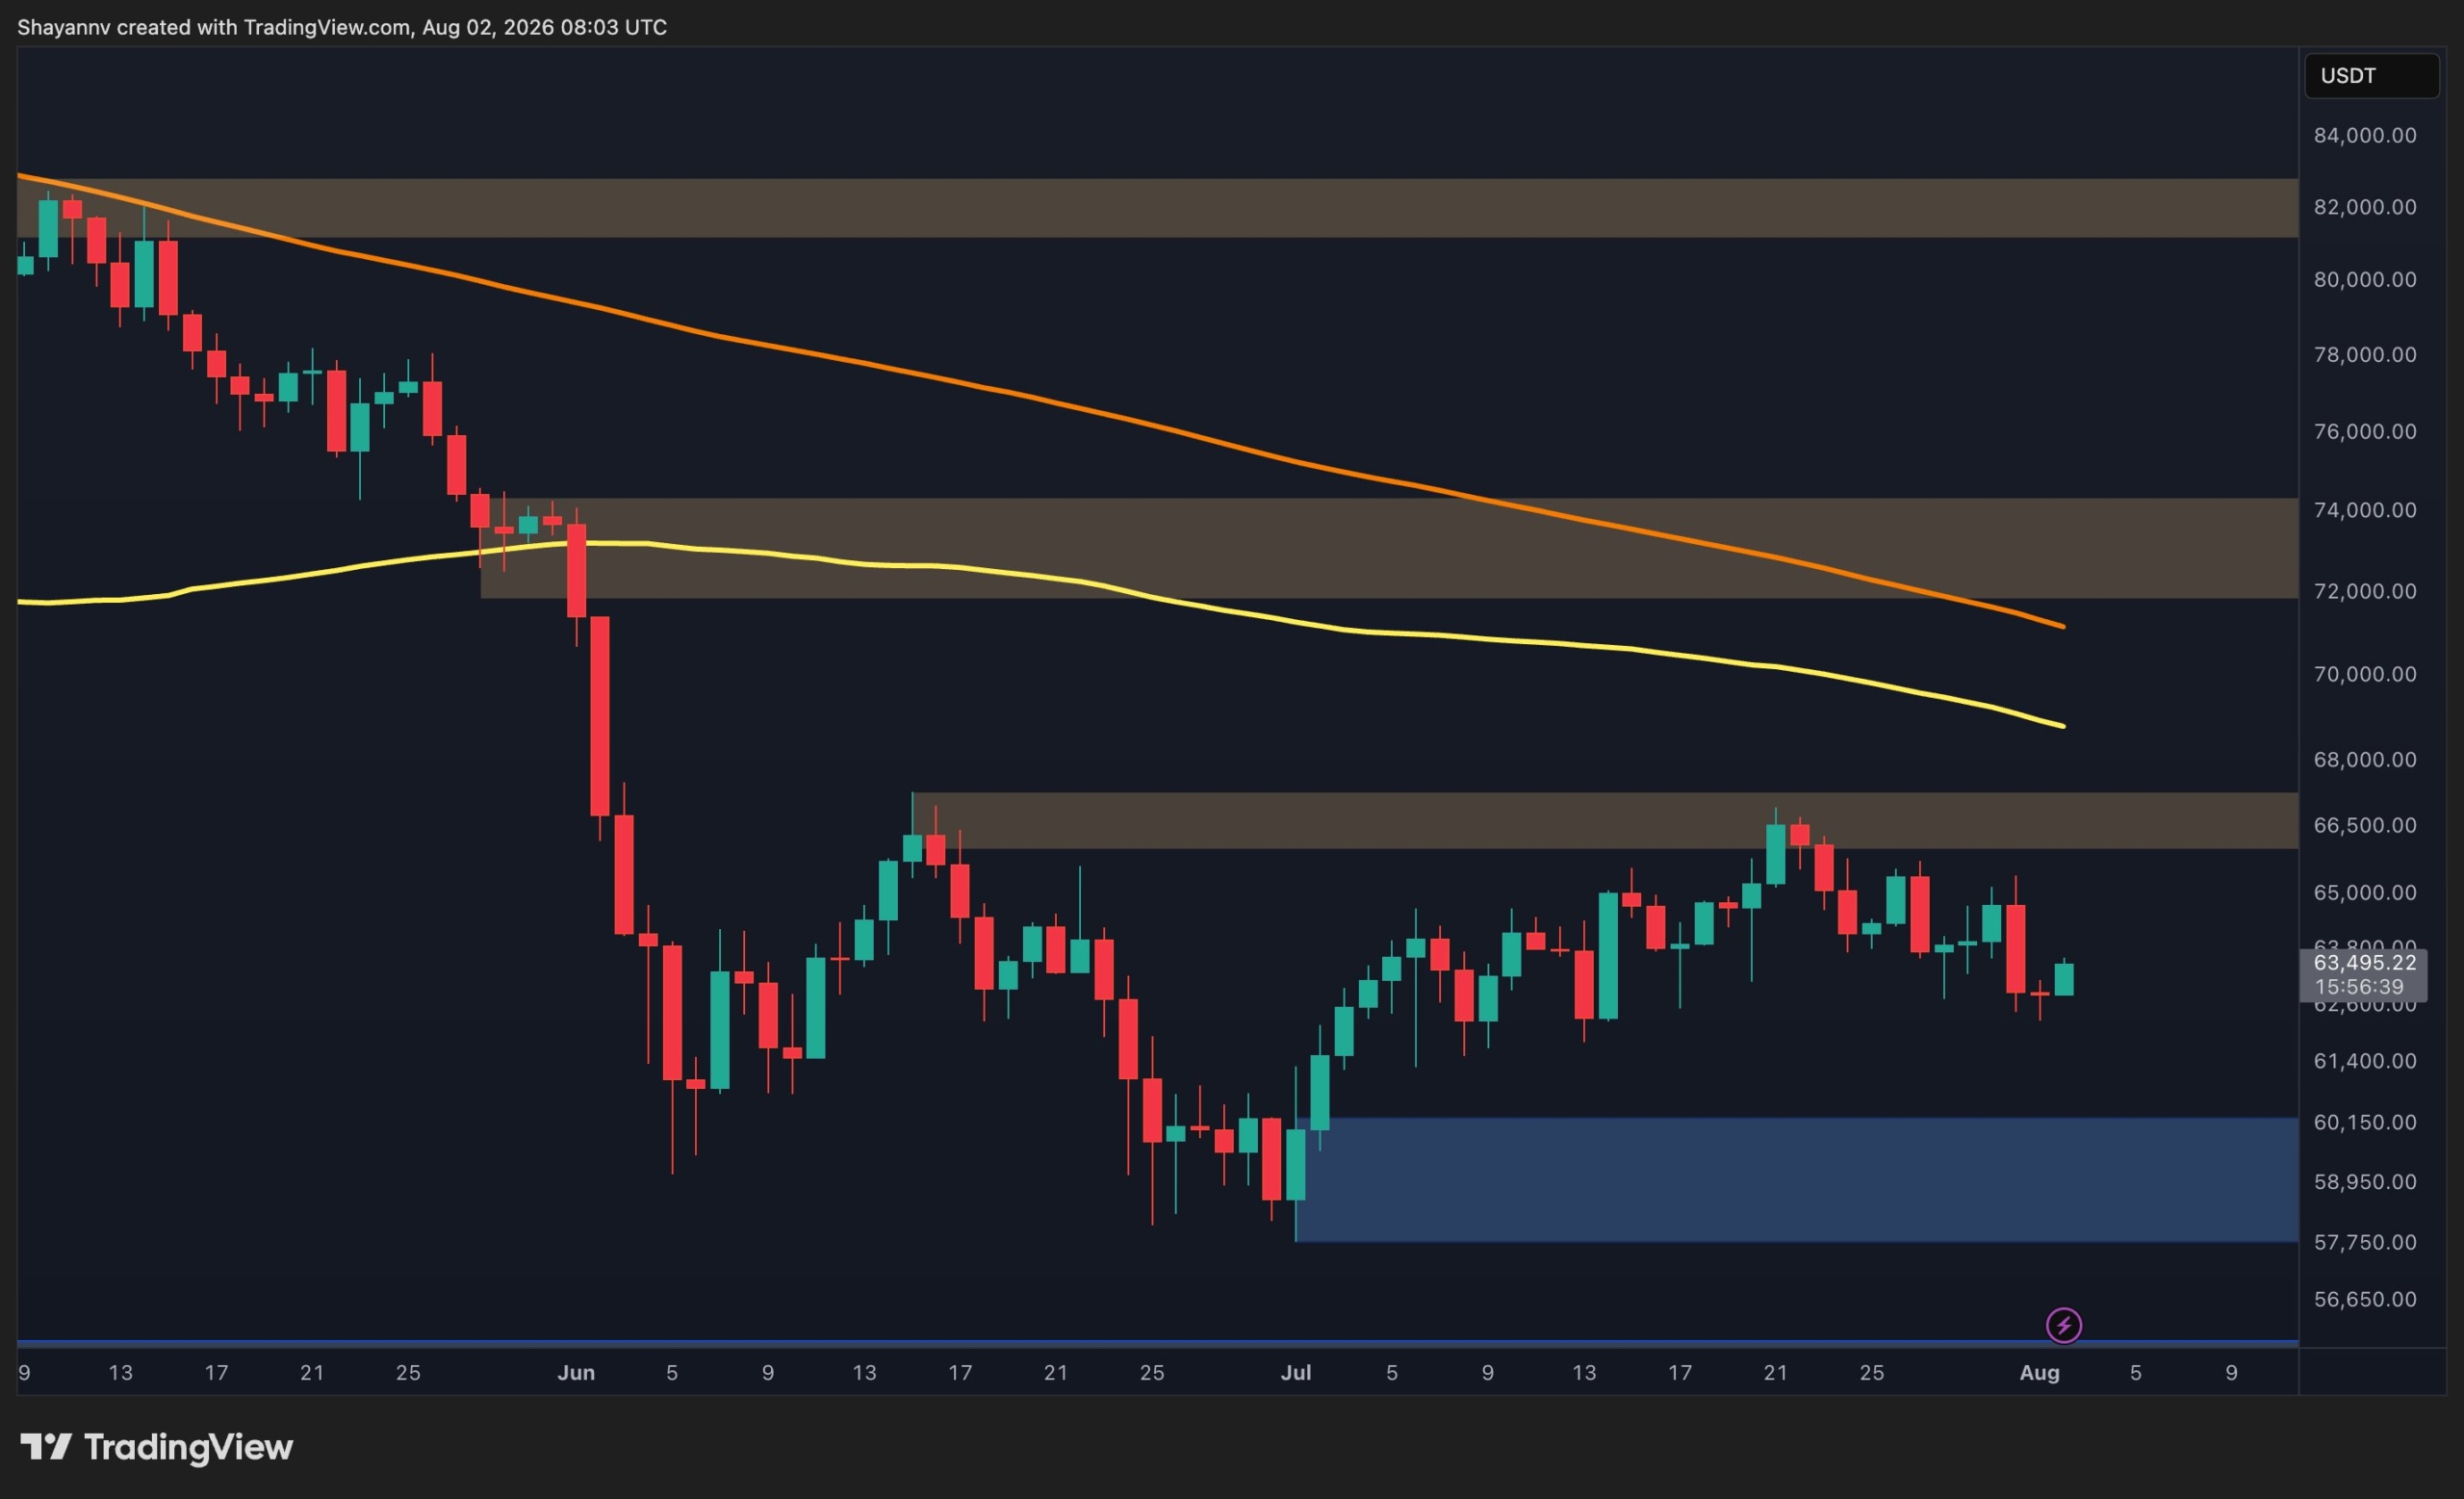
Bitcoin continues to trade without a decisive directional bias as both buyers and sellers defend key technical levels. Until one side forces a confirmed breakout, the current environment is likely to remain dominated by range-bound price action and short-term liquidity grabs.
Bitcoin Price Analysis: The Daily Chart The daily chart suggests Bitcoin is still locked in a prolonged consolidation phase between the major support around $57.8K to $60.2K and the primary resistance at $66.2K to $66.8K.
Despite several attempts by both buyers and sellers, neither side has managed to establish a sustained trend beyond these boundaries.
This type of market structure typically favors liquidity sweeps and stop hunts around local highs and lows before a genuine directional move develops.
This page shows the RSS-provided summary/preview. Full publisher content remains available at the original source.
Read Full Article at Source